You can use surveys to get an overview of your students’ opinions, situations or viewpoints in your course. Students can submit anonymous responses, or responses can be associated with their names.
Surveys are easy to create in Brightspace and having the survey tool integrated into the rest of the course content makes it quick and easy to use for students.
However, many students forget to select the ‘Submit’ button at the end of the survey and instead, only select ‘Save’ which does not complete the survey.
Some instructors resolve this by making a final, mandatory ‘question’ in which the students are reminded to press ‘Submit’ when done.
- To create a survey, go to Course Admin and select Surveys.
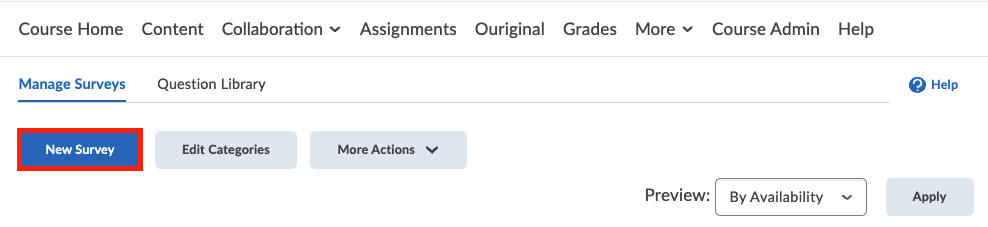
- The “Edit Survey” page will open. Click on New Survey.
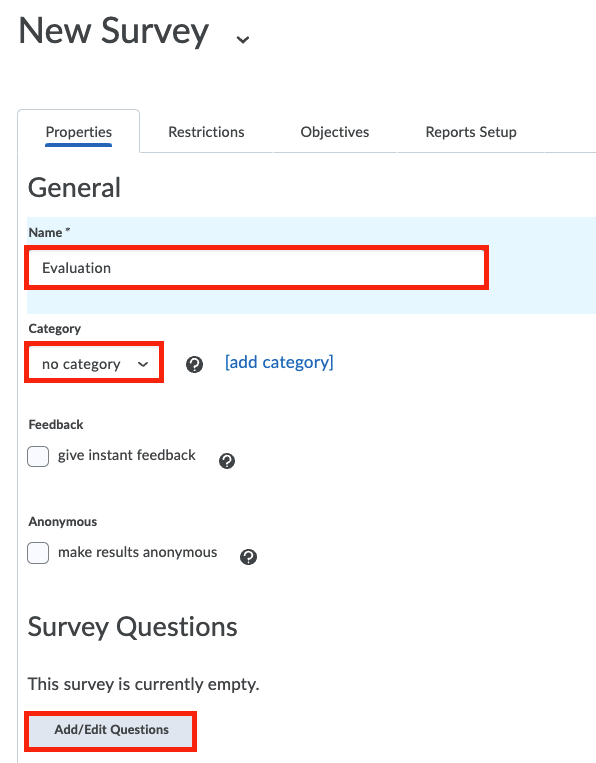 Type the name of the survey in the field provided. If you want to create various surveys in your course, it is a good idea to categorize them. Select a previously created category from the drop-down list, or create a new one. Next, tick the check boxes if you want to receive instant feedback on every survey submission, and if you want the surveys to be completed anonymously by your students.
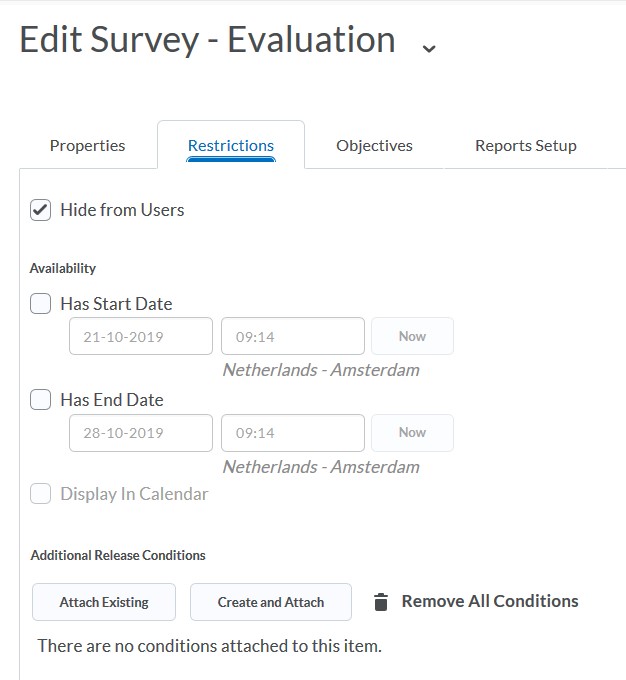
 - Click on the Add Questions button to add survey questions. For detailed instructions about how to add questions, please refer to the tutorial in the Creating Questions in Quizzes, Surveys, and Self-Assessments page. You can opt to add a description and a page footer to the survey. Also take note of the Restrictions and Reports Setup tabs, where you can set the survey to be in hidden mode, number of allowed responses per participant, and develop customised reports.
- Lastly, on the “Properties” tab, invite the students to complete the survey – click on the Invite Participants button. The “Survey Invitation” page will open. Here you can customize the message and select the participants for the survey. Note that the variables {FirstName}, {LastName} and {SurveyName} will be replaced automatically once you send the survey.
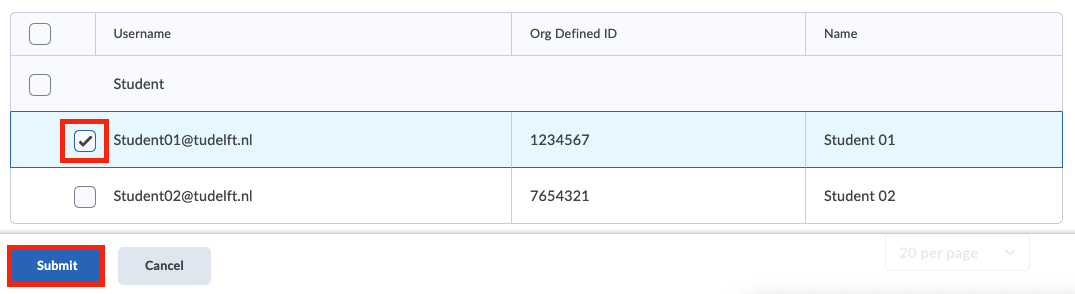
- Click on Submit to send the survey. The participants will receive a link to the survey in an email.
- Once your students have inserted their responses they can save them by clicking the
Savebutton. Once they are ready to submit the survey, they should click the Submit button. Please do remind your students that to successfully submit their Surveys they will need to click not only Save but also Submit.
- Go to Course Admin and select Surveys.
- Select the survey you wish to get a report from and select Edit from the dropdown menu. In this new menu select the Report setup tab.
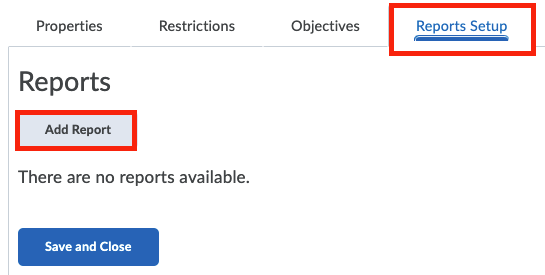
- Select Add report. In a new window, add a report name and define what type of report you wish to generate. You can have two types of reports.
- Summary Report – You can display aggregate data for multiple choice, true and false, Likert, multi-select, and matching question types. You can also display text responses for written response, short answer, and fill in the blanks question types.
- Individual Attempts – This report displays each attempt individually. You can choose to hide the user’s first and last name when the Individual Attempts report is viewed.
- Define which roles within your course you allow to have access to this report, including your own role, under the field “Release report to”. Click on Save to finish the set up.
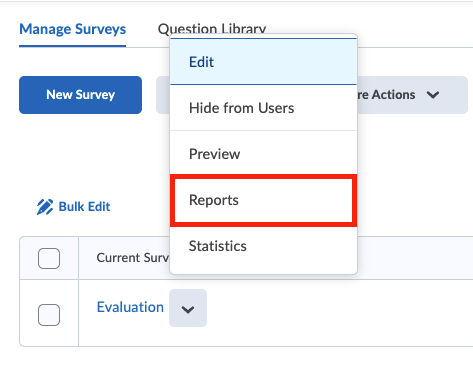
- To view the survey report, go to the survey and click on the dropdown menu and select Reports.
- Click on the link to the report. Reports can be generated as an .CSV, Excel or HTML file. On a new page generate a new report by exporting it to the format you prefer.
There are 3 formats in which to receive the survey results:
- .CSV file: You will be presented with columns in which, per possible answer, the question text is listed in rows with the number of responses to a particular answer, as a value. This could serve well as the source for a Pivot table.
- Excel File: The excel format is identical to the CSV file once imported into Excel.
- HTML view: The exact set up of the HTML view varies depending on the type of the survey created and cannot be adjusted. It is only used for a quick view of the survey results.
There is also the possibility to print the Survey report directly from Brightspace but this shows the HTML view only.
The exported results from a Brightspace survey can be very unclear and cluttered. Below is explained how to structure these results with an example.
In the following example course, the Survey Tool was used to record the preferences from students for project subjects. Students were asked to order the topics from favourite to least favourite. The picture below shows the results from this survey for one student.

Clearly this is not very usable. Follow the steps below to improve the file.
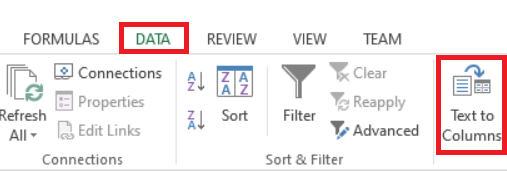
- Split the data into columns by using the Text to columns button, which is under the Data-tab in Excel.
- A dialogue box will appear. Check Delimited and click Next >.
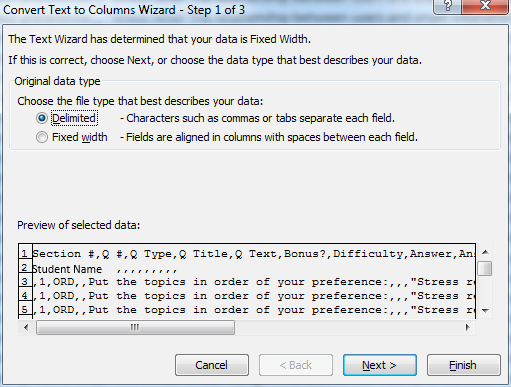
- Under Delimiters select Comma and click Next >.
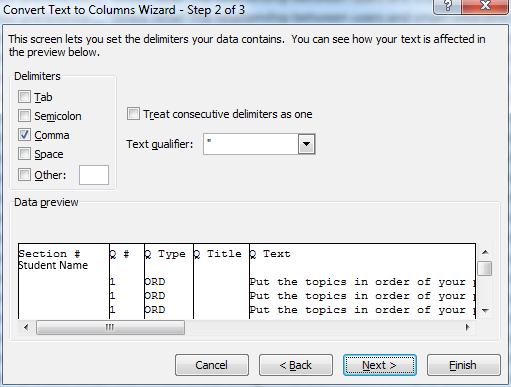
- You do not have to change anything in the next window. Just click Finish. Your excel file will now be split into columns, but still contains useless information.
- Use the Filter tool to filter only the answers the students picked.
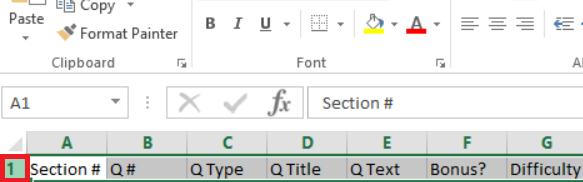
- Click on 1 on the top-left of your screen to select the first row.
- Click on the Filter on the Data-tab:

- You now have drop-down menus on the first line of the document.
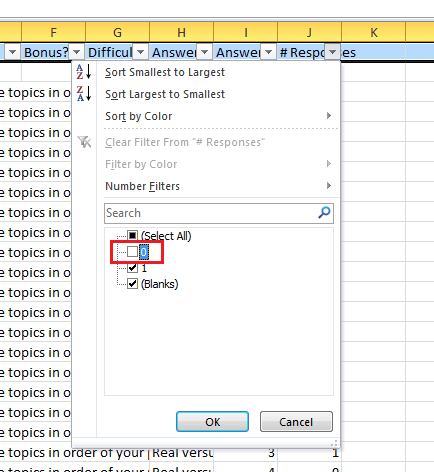
- Click on the drop-down arrow in column J, deselect 0 and click OK.
- Click on 1 on the top-left of your screen to select the first row.
- Your window will now look something like this:
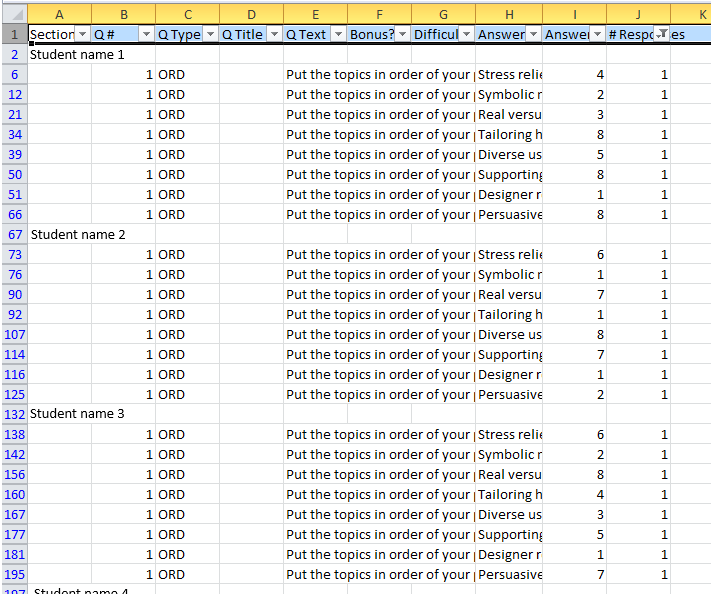
- Now we want to throw away all of the useless data which is still in the file, but no longer visible. The easiest way to do this, is by opening a new file and copying our data.
- Click on File in the top-left corner. Click New > Blank workbook.
- Go back to the original workbook.
- On your keyboard, use CTRL+A and CTRL+C consecutively to copy the data you just filtered.
- Go to your new workbook, select cell A1 and use CTRL+V to paste all of the filtered data to a new workbook.
- You can now save this new workbook.

